
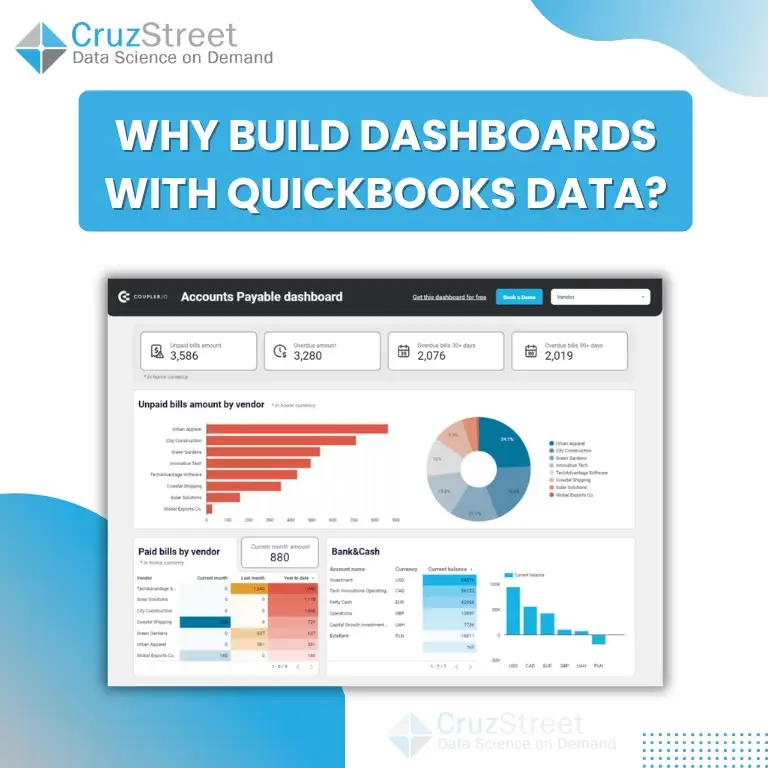
Whether you're using QuickBooks Online or QuickBooks Desktop, it's one of the most widely adopted financial systems for small and mid-sized businesses. But as your organization grows, so does your need for faster, deeper financial insights.
That's where real-time dashboards come in. Below are the core reasons to build dashboards using QuickBooks data — plus what QuickBooks' own AI can and _can't_ do for you.
1. Advanced Visualizations
QuickBooks reports are static. You can export P&Ls or balance sheets, but visual customization is limited and not ideal for storytelling.
Dashboards built in BI tools like Amazon QuickSight, Power BI, or Looker offer:
- Dynamic charts, graphs, and drilldowns
- Custom KPI tracking
- Forecasting visualizations
- Multi-year, multi-entity financial views
- Executive-ready designs
> You go from tables and CSVs to visual insights that spark decisions.
2. Real-Time or Scheduled Data Refresh
QuickBooks doesn't update reports in real time. By integrating QuickBooks with a BI tool, you can:
- Set up hourly or daily refreshes
- Eliminate the need to manually export data
- Trust that you're working with the most current financial picture
> No more wondering "Is this the latest version?"
3. Cross-System Integration
QuickBooks alone doesn't show you the _whole business picture_.
By integrating with:
- CRM (like HubSpot or Salesforce)
- ERP systems
- Inventory or POS data
- Marketing platforms
- Payroll & HRIS tools
…you can blend financials + operational data to see what's driving profitability, growth, and risk.
4. Role-Based Dashboards for Stakeholders
QuickBooks is a great accounting tool — but not everyone in the company needs a general ledger.
Dashboards let you:
- Build custom views for Finance, Sales, Marketing, or the CEO
- Limit access to sensitive financials (e.g., margins or payroll)
- Deliver insights _without giving full QuickBooks access_
> Give every team the data they need, not just accounting reports.
5. Smarter Forecasting & Cash Flow Planning
Using a dashboard layer:
- Automate budget vs. actual tracking
- Visualize cash flow trends
- Run scenarios (What happens if we increase expenses by 10%? Delay invoicing by 15 days?)
- Monitor burn rate in real time
This is difficult or impossible to do natively in QuickBooks without extensive manual effort.
6. What About QuickBooks' Built-In AI?
QuickBooks has begun embedding AI features such as:
- Categorizing expenses
- Flagging anomalies
- Auto-reconciling transactions
- Predicting tax liabilities
- Smart invoice scheduling
These AI tools are helpful for day-to-day bookkeeping, but they're:
- Operational, not strategic
- Internal-facing, not stakeholder-ready
- Not built for custom KPI dashboards or integrated analytics
> QuickBooks AI helps automate your books — but it doesn't answer big business questions.
To gain strategic insight (like profitability by customer segment or forecasting ARR), you still need a true analytics layer.
7. Ease of Implementation & Scale
With tools like Amazon QuickSight or Power BI, Cruz Street can:
- Connect your QuickBooks data using secure APIs or middleware
- Set up dashboards in weeks, not months
- Scale your reporting as your business adds entities, products, or departments
These dashboards grow with you — unlike QuickBooks' limited report set.
8. Get from Report to Action Faster
With dashboards:
- Executives can spot trends faster
- Finance can answer "what's driving this?" in seconds
- Teams can act on the same data, instead of working from silos
That means better decisions, faster — and with less friction.
Final Takeaway
QuickBooks is great for managing the books. But if you want to leverage your financial data for strategy, growth, and real-time decision-making, you need dashboards that go beyond what QuickBooks was built for.
Cruz Street helps you:
- Connect your QuickBooks data securely
- Blend it with other systems
- Visualize it in ways your team can actually use
- Automate your insights — so you spend less time chasing numbers and more time using them